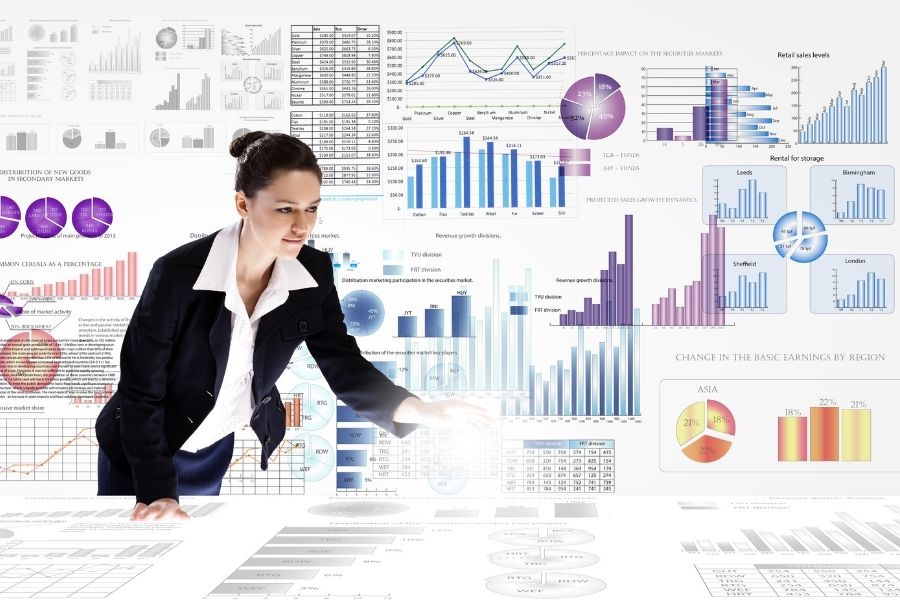
People and businesses must clearly understand vast amounts of data in the digital age. Data visualization, a mix of art and science, changes how we look at massive amounts of data. We need tools to turn the vast amounts of data being made into insights.
With live dashboards and complicated images, it’s easier to understand things that are hard to grasp. This article will give a complete picture of all the tools out there.
Our in-depth guide will help you find the right data visualization tools! Whether you’re a business owner, a data scientist, or just someone interested. Check out data visualization to find out more.
Introduction to Data Visualization
Source: Canva Premium
In today’s digital age, businesses grapple with interpreting vast amounts of data, and that’s where data visualization tools play a crucial role. It doesn’t merely present data but transforms intricate datasets into comprehensible visuals. Through data visualization tools examples like charts, graphs, and other tools, trends, patterns, and outliers become more discernible.
This approach is essential, especially for those who aren’t well-versed in data. Given the advent of big data and the increasing need to make decisions based on data, data visualization isn’t just a tool but a necessity.
Entities ranging from businesses to governments use data visual tools for planning, identifying opportunities, and problem-solving. As we continue to generate more data, the methods to present data will evolve with technology, fostering a mindset that is more analytical and paving the way for a future rooted in data-driven insights.
The Importance of Effective Data Visualization

Source: Canva Premium
Picking the correct data display tool is important for getting valuable insights from data analysis. There are many data visualization tools to choose from, and each one is designed to meet a particular need:
- When you want to compare different data types, bar and column charts are great because they make the comparisons clear.
- Pie charts are great for showing parts of a whole, and they’re also a simple way to show percentage ranges.
- Heat Maps: These use color changes to show data values and are great for finding patterns in data. This data is spread out over time or space.
- Scatter plots are a way to see how two factors are related. They can show correlations or oddities.
- Line graphs are used in financial and trend studies because they make it easy to see how things change over time.
- Treemaps break up structures into nested squares to show data hierarchically.
- Interactive Dashboards: Platforms like Tableau and Power BI give users interactive visuals. It lets them dig deeper into numbers.
Key Features to Look for in a Data Visualization Tool
Source: Canva Premium
Finding your way around all the different data visualization tools for showing info might take a lot of work. But paying attention to a few key points will help you get the most out of the best data features:
- Interface that is Simple to Use: The tool for making images should be simple for beginners and experts.
- Many ways to look at data: The device should show data in a variety of ways, such as pie charts and scatter plots.
- Interactivity: New tools should let you communicate with pictures. Scroll down to find out more.
- Visuals stay up-to-date and applicable by automatically combining data sources.
- Changes: You should be able to change charts and graphs to fit your brand or personal tastes.
- Collaboration Tools: Sharing, commenting, and changing pictures is helpful for group projects.
- Scalability: As your collection grows, the tool should be able to store more info without slowing down.
Popular Data Visualization Tools in the Market
Data analysis is hectic, but a few data display tools have stood out. Each one has its strengths:
Google Charts
A product of the tech giant, Google Charts stands as a versatile platform, allowing users to craft a myriad of charts and graphs quickly.
Key Highlights
Free of cost, seamless integration with Google products, and various chart options.
Tableau
Often regarded as a titan in the industry, Tableau merges a user-friendly interface with sophisticated data visualization techniques.
Key Highlights
Intuitive drag-and-drop feature, vast connectivity to data sources, and community-driven resources.
Grafana
Tailored for those in monitoring and observability spheres, Grafana presents potent visualization choices, especially for time-series data.
Key Highlights
Dynamic dashboard creation, plugins for extended functionalities, and robust alerting features.
Chartist
Chartist, a JavaScript library, offers the tools to design responsive and interactive visuals for those leaning toward coding.
Key Highlights
Customizable with CSS, responsiveness out of the box, and simple API for customization.
FusionCharts
Carving its niche, FusionCharts is lauded for its broad library comprising interactive charts and geographical maps.
Key Highlights
It has an extensive charting library, real-time data updates, and easy integration with popular frameworks and languages.
Open Source vs. Proprietary Visualization Tools

Source: Canva Premium
There has been a long-running argument in the field of data science about whether to use open-source or closed-source methods to display data. Open-source tools like D3.js and Chartist are liked by fans because their code is clear, they can be changed, and there are no licensing fees. Using a community-driven method, these tools take advantage of global progress, making sure they stay on the cutting edge of how to handle different types of data, including large amounts of data.
On the other hand, closed-source platforms may not be free, but they come with full support, frequent updates, and an easy-to-use interface. A lot of businesses like these systems because they let them see a lot of different kinds of info with little setup. Proponents of open-source software stress how flexible and inexpensive it is, while supporters of private software stress how strong and dependable it is. Which of these platforms to use should depend on the project’s data points, funds, and goals for data visualization.
Best Practices for Effective Data Visualization

Source: Canva Premium
In today’s data-driven world, it’s essential to show facts clearly. Making complicated sets of data into easy-to-understand pictures speeds up decision-making. It helps people understand better. To get the most out of a data display:
- Refrain from complicating: Start with a goal in mind and get rid of info and photos that aren’t needed.
- Pick out a Chart: Figure out what your story is about. Line charts show trends, bar graphs compare things, and pie charts show numbers.
- Putting colors together: Choose only a few colors, and make sure that the ones you choose don’t change how you see the facts.
- Engaging Elements: Include interesting elements to help people learn more about the data and make it more relevant to them.
- Keep an eye on the scale: Scales should always show the same thing and not lie.
- Accessibility Is Important: Plan for everyone, even those who are colorblind or have trouble seeing.
- Write notes with thought: Labels, symbols, and subtitles that are short and simple can help people understand your show.
Case Studies: Successful Data Visualization in Action
In this rapidly evolving era, there’s a pressing need for researchers, businesses, and groups to present complex concepts in an easily digestible manner. Good data visualization helps in simplifying large data sets, making the information more comprehensible for users.
Through effective visualization, mundane data can be transformed into compelling visual narratives, aiding individuals in identifying trends and making informed decisions.
Brands are increasingly leveraging advanced tools to visualize data, aiming to make vast amounts of information more understandable. Investing in data visualization tools and strategies not only enhances the quality of content but also captivates the audience, facilitating better decision-making processes. As businesses recognize this trend, it’s becoming evident that one of the most impactful ways to disseminate data online is through adept data visualization.
Future Trends in Data Visualization

Source: Canva Premium
In our progression deeper into the Information Age, the representation of data plays a pivotal role in shaping our comprehension and utilization of it. With the advent of AR and VR technologies, data is not just represented, but it’s brought to life in three dimensions, offering a transformative experience.
Using visual aids powered by AI and machine learning, visualization software can swiftly generate images tailored to each user. As the volume of big data expands, the demand for real-time visualizations to derive instantaneous insights becomes imperative. The emergence of user-friendly tools is a testament to this evolution, enabling individuals across skill spectrums to represent data visually.
As storytelling remains a cornerstone for data interpretation, we anticipate a surge in visual presentations employing richer and more engaging narrative techniques. All these advancements underscore a promising trajectory for data displays with a central focus on user engagement and understanding.
Final Thoughts: Making the Most of Your Data Visualization Tool
Lastly, there have never been so many powerful and practical tools for showing data. These tools help businesses, academics, and regular people. It helps them to make sense of vast amounts of data by turning numbers into visual stories.
These tools will help us learn more and get things done faster as we collect more data. To stay up to date and informed in the digital world, you must use and understand different visualization systems. Even though we discussed current technologies, AI is improving and goes beyond images.
Read our post on the best visual collaboration platforms to discover more AI solutions that will change the future. Everything changes when you travel with data, visuals, and AI.
Frequently Asked Questions: Data Visualization Tools
Why is data visualization important?
Data visualization is important because it provides a graphical representation of information and data, enabling individuals and organizations to comprehend complex data sets quickly and derive insights. Through visualization, important data becomes more accessible, facilitating better decision-making processes.
What benefits does data visualization offer?
The benefits of data visualization include the ability to:
– Quickly interpret vast amounts of data
– Identify patterns, correlations, and trends
– Simplify complex data sets
– Improve the speed and accuracy of decision-making
– Enhance data storytelling for broader audiences
What are some common visualization techniques?
Common visualization techniques include bar charts, line graphs, scatter plots, pie charts, heat maps, and geospatial visualization. The choice of technique often depends on the type of data being presented and the insights one aims to draw.
Can data visualization handle unstructured data?
Yes, data visualization tools provide methods to present unstructured data in a comprehensible manner. With the right tools and technologies, even unstructured data can be visualized effectively, helping data professionals better understand and utilize the information.
Are there specific tools available for data visualization?
Yes, there are numerous data visualization software and tools available in the market. Examples of data visualization tools include Tableau, Power BI, D3.js, and many more. These tools offer varied visualization methods based on the data at hand.
How does data visualization relate to data analytics?
Data visualization is the graphical representation of results derived from data analytics. While data analytics focuses on processing and analyzing data sets, data visualization comes into play to present these findings in an understandable form. Data visualization makes the insights derived from analytics more comprehensible to stakeholders.
Who benefits the most from data visualization?
Data analysts, data scientists, researchers, and other data professionals stand to gain significantly from data visualization. However, given the importance of data in today’s world, nearly everyone, from business decision-makers to the general public, can benefit from understanding data through visualization.
How can one learn more about data visualization?
To learn how data visualization works and its intricacies, individuals can take online courses, attend workshops, read relevant books, and experiment with visualization tools available in the market.
Do all data visualization tools come at a cost?
No, while many data visualization software options are paid, several free tools don’t incur costs. For instance, D3.js is an open-source tool available for users who want to visualize data without investing in premium tools.
Is every visualization technique suitable for all types of data?
Not necessarily. The choice of visualization technique, whether it’s a type of chart or a more advanced visualization that shows geospatial information, depends on the nature of the data as a set and the insights one hopes to gain. It’s crucial to match the visualization method with the data’s characteristics to ensure clarity and accuracy.


